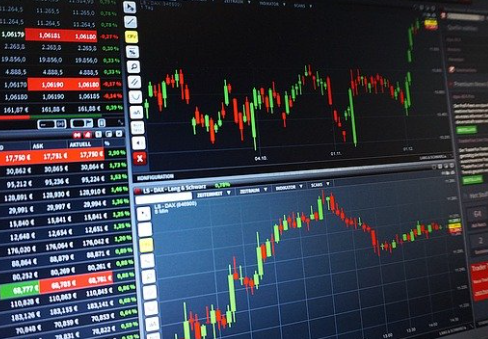
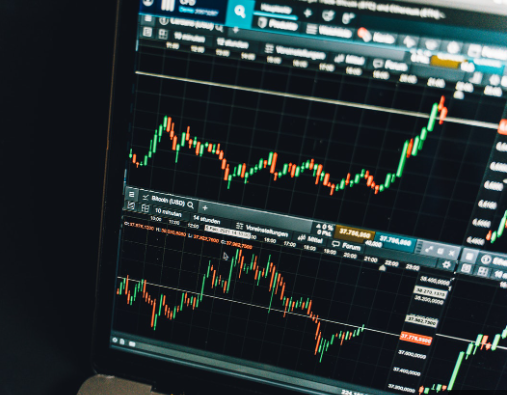
To utilize technical analysis in forex trading, traders must examine price and volume data via charts and statistical indicators. They may use tools like moving averages, trendlines, oscillators, and chart patterns to evaluate market conditions. The main objective of technical analysis is to identify trading opportunities based on trends, support and resistance levels, and other technical indicators. By analyzing market trends and patterns, traders can determine potential entry and exit points for buying and selling securities. Additionally, technical analysis can help traders manage risk and optimize their portfolio.
Understanding Technical Analysis in Forex Trading
Technical analysis is a widely used method for analyzing financial markets such as forex trading, which involves studying price charts and other technical indicators to recognize potential trading opportunities, patterns, and trends. This analysis method believes that historical price data can offer insights into future price movements and predict market trends and momentum. Technical analysis tools and indicators include trend lines, moving averages, oscillators, support and resistance levels, and many others. By utilizing technical analysis, traders aim to make objective trading decisions based on market signals and data instead of subjective factors or emotions.
Key Technical Indicators and Tools
In forex trading, traders use several key technical indicators and tools to analyze the market. Moving averages help identify trends, while trendlines can indicate support and resistance levels. Oscillators like the Relative Strength Index (RSI) and Stochastic Oscillator provide signals of overbought or oversold conditions. Other crucial tools include Fibonacci retracements, which identify potential reversal points, and Bollinger Bands, which indicate volatility and potential price breakouts. To develop effective trading strategies, traders often use a combination of these tools and indicators to analyze market trends and make informed trading decisions.
Identifying Trends and Chart Patternsf
When using technical analysis in forex trading, traders need to identify trends and chart patterns. Trends refer to the overall direction and strength of price movements, which can be detected using technical indicators such as moving averages and trend lines. Meanwhile, chart patterns are formations on price charts that suggest potential trend continuation or reversal, including head and shoulders, triangles, and double tops/bottoms. These patterns can help traders determine when to enter or exit trades. By effectively identifying trends and chart patterns, traders can make more informed decisions and improve their chances of success in the forex market.
Using Technical Analysis for Entry and Exit Points
Technical analysis is a useful tool for identifying potential entry and exit points for forex trades. Moving averages can be used to track trends and find entry points when the price crosses above or below the moving average.. Oscillators such as the RSI and Stochastic Oscillator can signal overbought or oversold conditions, helping traders decide when to enter or exit a trade. Using a combination of these tools and indicators can improve the accuracy of entry and exit points and increase the chances of making profitable trades in the forex market.
Incorporating Risk Management into Technical Analysis
When applying technical analysis in forex trading, it is vital to include risk management strategies to reduce the possibility of losses. Traders need to set stop-loss orders to control losses and use position sizing to manage the amount of risk per trade. Furthermore, technical indicators like the Relative Strength Index (RSI) and the Average True Range (ATR) can help traders determine market volatility and adjust their risk accordingly. By integrating risk management techniques into technical analysis, traders can safeguard their capital and reduce the impact of market fluctuations on their trading accounts, thereby enhancing their potential for long-term success.
Limitations of Technical Analysis in Forex Trading
When it comes to forex trading, technical analysis has some limitations that traders must consider. Firstly, technical analysis is based on historical data, and therefore, it may not be able to predict future market movements accurately. Additionally, technical analysis may not take into account fundamental factors such as economic policies, political events, or breaking news that can significantly affect the market. Furthermore, the interpretation of technical indicators can be subjective, leading to different trading decisions among traders. As a result, traders should complement technical analysis with fundamental analysis and proper risk management strategies to make well-informed trading decisions.
Conclusion
In summary, technical analysis is a widely used technique among forex traders to analyze market trends, identify potential trading opportunities, and make informed decisions. With the help of various tools such as trend analysis, chart patterns, and technical indicators, traders can gain insights into market movements and identify potential entry and exit points. However, it’s critical to incorporate risk management strategies into technical analysis to minimize potential losses and safeguard trading capital. Ultimately, traders can increase their chances of long-term success in the forex market by combining technical analysis with sound risk management techniques.