

A person analyzing a holographic financial chart on a tablet device.
Technical analysis is an indispensable part of a trader’s toolkit, offering insights into future market behavior through examination of the past market data. This guide, presented by InternationalReserve analysts, delves into the essentials of technical analysis, highlighting its core aspects.
Introduction to Technical Analysis: Basics and Principles
Technical analysis is an approach used by traders to forecast the direction of future prices as per historical market data. Unlike its counterpart, fundamental analysis, which determines the value of a security based on business results and economic indicators, technical analysis explores patterns and trends to predict upcoming price activity.
The main principle of technical analysis is that all market information is already reflected in prices. Hence, the attention moves to price movements themselves rather than the external factors that cause them. This strategy is epitomized by the slogan “It’s all in the charts” which implies that the key to understanding market movements lies within the price charts themselves.
Another fundamental assumption of technical analysis is that history tends to repeat itself. The reason for this is the overall market psychology, in which traders often react in a predictable manner when they face similar market situations. Through historical price movements analysis, technical analysts aim to predict future price behavior, focusing on the probabilities rather than the certainties.
Components of Technical Analysis
Here are some central concepts that form the backbone of technical analysis.
Support and Resistance
Support and resistance levels are considered to be the cornerstone of price action, where prices are likely to halt and reverse direction. The support levels are where the price usually finds a floor and then rebounds upward, while resistance levels are where the price often tops and begins to fall again. Identifying these zones may give technical traders hints about possible reversal points.
Trends and Ranges
A key concept within technical analysis is the identification and understanding of market conditions, including uptrend, downtrend, or range.
An uptrend is characterized by an increase in prices, a downtrend by a decrease in prices, and a range by prices moving within a certain upper and lower boundary. Determining these states is crucial for recognizing potential shifts in market momentum.
Candlestick Charts
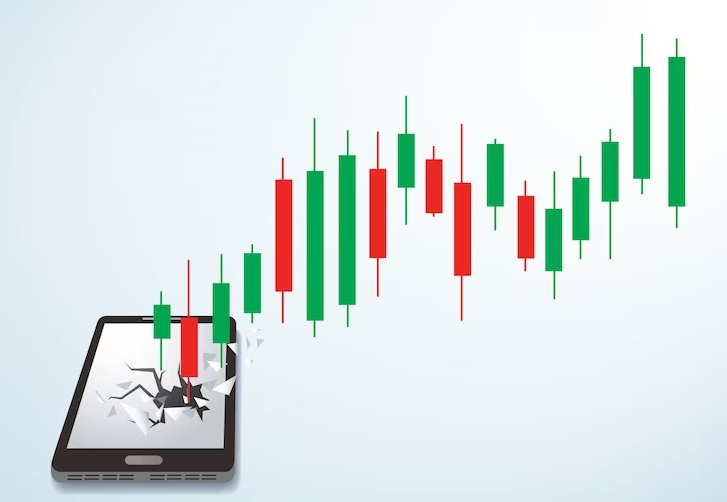
Chart candlesticks protruding from mobile phone
Most technical traders prefer candlestick charts, as they give a detailed overview of the prices within a certain time period. Every candle shows the opening, closing, high, and low prices, with certain patterns indicating potential future price movements.
Technical indicators
Indicators are the basis for technical analysis, being the tools that give traders the quantitative data obtained from the market activity, like price movements and volume. Thousands of these tools are developed to forecast future price directions and to identify possible trade opportunities.
Indicators are broadly categorized into two types: leading and lagging. Leading indicators, e.g. RSI (Relative Strength Index) and Stochastic Oscillator, are used to predict future market movements before they actually happen while the lagging indicators, for example, the MACD, are those that confirm the trend’s direction and strength after it has started.
Note that InternationalReserve is a notable broker that offers traders a comprehensive suite of essential technical tools and indicators, designed to facilitate trading with ease and efficiency. These tools empower traders to navigate the complexities of the market, leveraging the full potential of technical analysis to make informed decisions.
Timing Entries and Exits
Successful technical analysis is also about finding the right time to enter or leave trades. This can be attained by analyzing various chart patterns and using technical indicators to identify when a security is in an overbought or oversold state.
Risk Management
Technical analysis forms an integral component of a sound risk management strategy as it can help prevent major losses. Through the use of stop-loss orders based on technical indicators, traders can better manage their risk exposure by limiting the downside potential while also contemplating the possibility of upside.
Conclusion
Through effective utilization of technical analysis principles, traders can strengthen their decision-making skills, take advantage of market opportunities, and manage risk successfully. As with any other skill, mastery of technical analysis comes with time, practice, and a commitment to continuous learning and improvement.