For profitable forex trading, it is imperative to analyze forex charts and trends. Traders employ technical analysis techniques, including trendlines, moving averages, and chart patterns to recognize trends, entry and exit points. Moreover, fundamental analysis is crucial too, which involves analyzing economic indicators and events that may impact currency values. By synergizing technical and fundamental analysis, traders can arrive at informed decisions and heighten their prospects of success in the forex market.
Introduction to Forex Charts and Trends
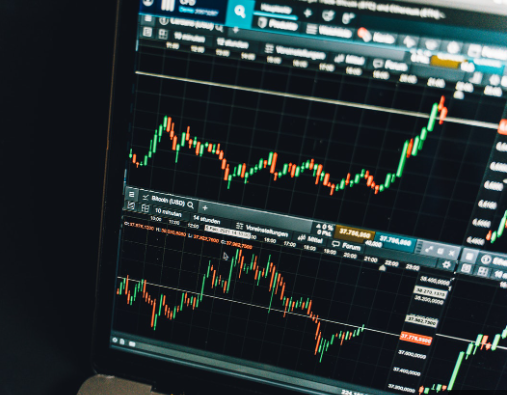
Forex trading relies heavily on charts that visually depict the movements of currency prices over time. These charts provide valuable information to traders, allowing them to observe patterns and trends in the market and make informed trading decisions. Forex charts come in various types, each with its own strengths and weaknesses. Technical analysis, which involves the use of indicators and tools to identify trends and predict future price movements, is a widely used approach to chart analysis. Meanwhile, fundamental analysis, which considers economic and political factors that can affect currency values, can be used alongside chart analysis to gain a more complete understanding of the market.
Types of Forex Charts
Forex charts come in three primary types: line charts, bar charts, and candlestick charts.
Line charts are the most straightforward, exhibiting solely the closing prices of currency pairs over a specified time period.
Bar charts present a broader range of data, including opening and closing prices, highs and lows, and trading volumes of currency pairs throughout a specific period.
Candlestick charts are comparable to bar charts, but they offer a more visually captivating representation of price movements using candlestick shapes. Every candlestick represents the opening and closing prices, as well as the highs and lows, of a currency pair for a specified period.
Traders adopt varying chart types depending on their preferences and trading strategies. While some prefer candlestick charts due to their visual appeal and ability to exhibit more information, others consider bar charts or line charts to be more accessible to interpret.
Understanding Candlestick Charts
Candlestick charts are widely used in Forex trading to illustrate price movements in a specific timeframe, usually a day or less. The candlestick chart displays the opening, closing, high, and low prices for the period it covers. The opening and closing prices are represented by the body of the candlestick, while the wicks, or shadows, indicate the high and low prices. The chart’s patterns can suggest various market trends and indicate potential trading opportunities. By gaining a good grasp of candlestick charts and patterns, traders can make better trading decisions based on market trends and price movements.
Identifying Support and Resistance Levels
In forex trading, support and resistance levels are critical notions that aid traders in identifying possible entry and exit points.
Support levels imply a price point where a currency pair has faced difficulty dropping below, indicating significant buying pressure. Conversely, resistance levels refer to a price point where a currency pair has had difficulty surging above, indicating robust selling pressure.
To identify support and resistance levels, traders can apply technical analysis tools such as trendlines, moving averages, and Fibonacci retracement levels. By recognizing these levels, traders can make well-informed decisions concerning trade entry and exit and appropriately manage their risk.
Trend Lines and Channels
Trend lines and channels are commonly used tools in Forex chart analysis for identifying trends and trading opportunities. A trend line is a straight line that links two or more price points on a chart, indicating the trend direction. Channels are formed by drawing parallel trend lines that connect the high and low points of a trend. They can help traders determine potential support and resistance levels, and decide on when to enter or exit trades. Combining trend lines and channels with other technical indicators can enhance the precision of trading decisions.
Moving Averages and Other Technical Indicators
To identify trends and potential entry and exit points, forex traders frequently use moving averages and other technical indicators.
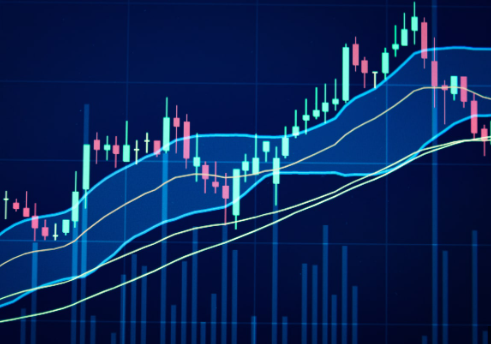
Moving averages, which smooth out price fluctuations over a specific time period, are useful in detecting the trend’s direction. Other technical indicators, such as the Relative Strength Index (RSI) and the Moving Average Convergence Divergence (MACD), provide further insights into a currency pair’s market conditions and momentum.
By incorporating technical indicators, traders can acquire a more comprehensive understanding of the forex market and make informed decisions about when to enter or exit trades. However, it is important to remember that technical indicators should be utilized in conjunction with other analysis methods and not relied upon exclusively for trading decisions.
Fundamental Analysis in Forex Trading
Fundamental analysis is a Forex trading approach that involves examining economic and political factors that may impact currency values. Traders who use fundamental analysis scrutinize indicators such as inflation, GDP, employment rates, and political events to assess the strength of a country’s economy and its currency. By comprehending the fundamental economic and political conditions, traders can make informed trading decisions and predict future market trends. Fundamental analysis can be used together with technical analysis to obtain a more comprehensive understanding of the market and make more precise trading decisions.
Combining Technical and Fundamental Analysis
To gain a better understanding of market conditions and improve their trading decisions, successful forex traders often combine technical and fundamental analysis. Technical analysis involves analyzing charts and indicators to identify trends, while fundamental analysis involves examining economic data, news, and events that can impact currency values. By integrating these two analysis methods, traders can obtain a more comprehensive view of the forex market, which can enhance their trading decisions. For example, a trader may use technical analysis to detect a potential trend reversal and then turn to fundamental analysis to evaluate whether any upcoming economic events could impact the currency pair’s movement. Overall, by combining technical and fundamental analysis, traders can improve their accuracy and success in the forex market.
Using Forex Analysis to Make Trading Decisions
Making informed trading decisions in Forex trading requires the use of various analysis methods, such as technical, fundamental, and sentiment analysis. Technical analysis involves examining past market data to identify patterns, trends, and potential price movements. Fundamental analysis looks at economic and political factors that can impact currency values, while sentiment analysis assesses the market’s overall mood and investor sentiment towards specific currencies or assets. Traders can use a combination of these analysis methods to gain a comprehensive understanding of the market’s current state and potential future trends, enabling them to make informed trading decisions. It is essential to continually analyze the market and adjust trading strategies to remain profitable in Forex trading.